There’s a new feature in the Tokyo release to display survey/assessments responses in a nicer format. Previously, trying to report on the responses was an absolute NIGHTMARE!
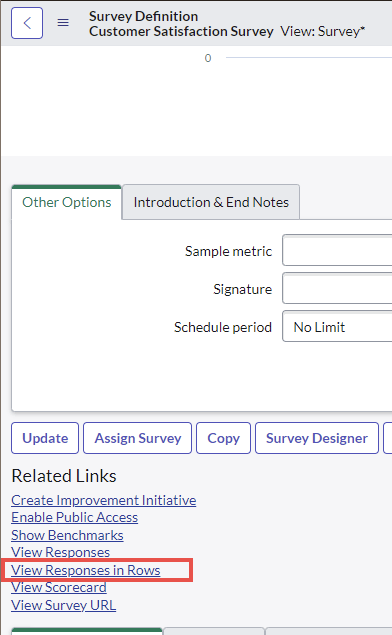
To use this new feature, in your Survey Definition, simply click on View Responses in Rows.
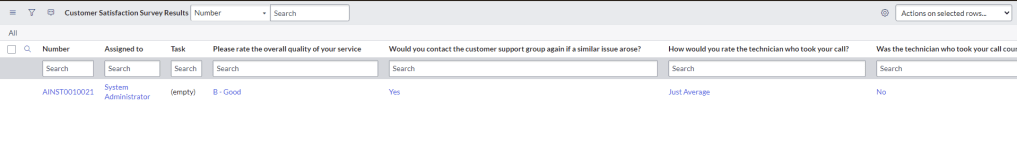
What this will do is essentially create a database view to nicely view the responses, with each question as it’s own column.
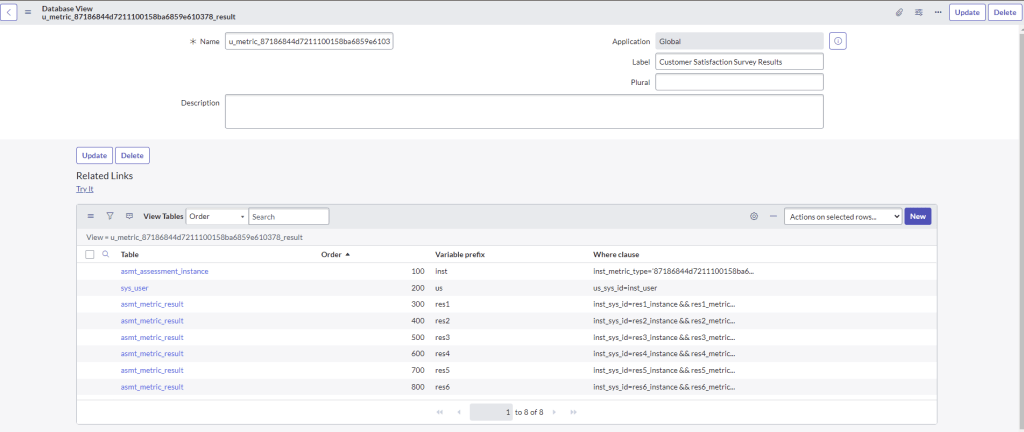
Example Database view here
See official documentation here.
